11 min read
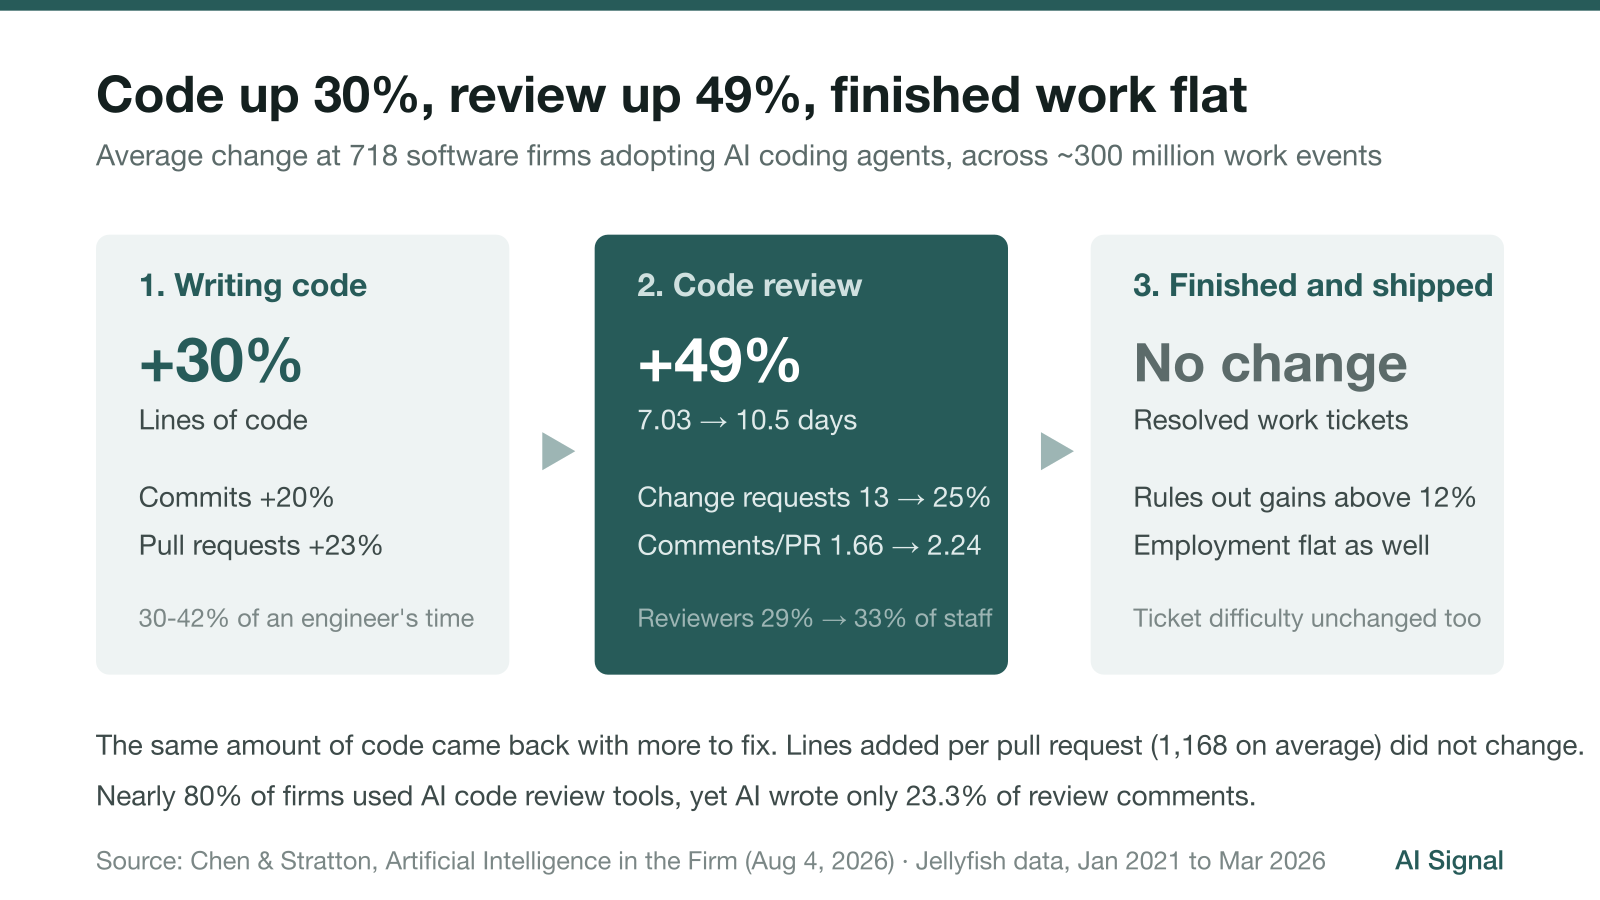
Software firms that adopted AI coding agents wrote about 30% more code. The number of work items they finished did not change in any measurable way. That comes from a paper by Fiona Chen and James Stratton of Harvard, released in August, which analyzed roughly 300 million work events at 718 software companies.[1]
The missing piece sits in the checking stage. Time spent in code review, where a colleague reads someone else’s code and points out what needs fixing, went up 49%.
What was counted
The data comes from Jellyfish, an analytics platform that companies use to see what their engineering teams are actually doing. It pulls in five kinds of records: HR information, version control activity from GitHub and similar systems, tickets from Jira and similar tools, meeting data from Google Calendar, and usage of AI coding tools.[1]
The sample runs from January 2021 to March 2026 and covers 725,938 workers at 718 firms: 200,945,700 commits, 49,050,030 pull requests, 68,281,845 Jira issues. The average firm had 1,652 employees, 241 active engineers, and was 19.3 years old. These are established companies, not startups.
Each of those three records measures a different stage. A commit is a saved checkpoint while writing code, like hitting save in a document. A pull request is a finished chunk of work submitted with a request to merge it into the shared codebase, and that is where a colleague reads it and asks for changes. A Jira issue is one work ticket, marked resolved only after the code is merged and deployed, and an epic is a bundle of those tickets making up a feature.
The tools were split in two. Autocomplete-style tools that suggest the next line as you type (GitHub Copilot, Cursor) count as AI coding assistants. Tools that take a high-level instruction, then edit multiple files, run tests, read the errors and iterate on their own (Claude Code, Cursor Agent, Devin) count as AI coding agents. Assistants became available on business licenses in February 2023, agents in November 2024.
The method is a staggered difference-in-differences design. Because firms adopted at different times, early adopters can be compared against later ones. The reason adoption timing varies has little to do with the technology: security and legal review, budget approval and pilot programs take anywhere from a day to several months depending on the company. The paper rests on the assumption that the length of that procurement process is unrelated to a firm’s growth trajectory.
What rose, and what didn’t
| Measure | AI assistants | AI agents |
|---|---|---|
| Lines of code | +12% (not significant) | +30% |
| Commits | +9% | +20% |
| Pull requests | +5% (not significant) | +23% |
| Resolved Jira issues and epics | No change | No change |
| Overall employment | No change | No change |
“Not significant” means the measurement is consistent with zero. For assistants, only the rise in commits held up statistically. For agents, all three measures moved clearly.[2]
On finished work the estimates were small positives whose error bands included zero. The top of the band is still informative: for agents, an output increase larger than 12% is ruled out.[3] Code went up 30%; finished output went up by at most 12%, and plausibly nothing.
The obvious objection is that tickets might have gotten bigger. The authors tested it. They had a language model read ticket descriptions and estimate how many hours an experienced engineer would need, then scaled that label across more than 60 million tickets with a supervised model. Average predicted difficulty did not change.
Employment stayed flat too. Headcount measured through LinkedIn profiles was a precise zero, ruling out a decline greater than 2.9%; engineering headcount was a noisier zero, ruling out a decline greater than 13.8%.[3] A 30% jump in coding productivity implies the same output could come from fewer people. That substitution does not appear in the data. Neither does extra hiring.
The bottleneck moved to review
Shipping software has four stages: decide what to build, write the code, review and test it, deploy what passes. AI sped up the second one.
Writing code was never the whole job. The authors imputed time use from the Jellyfish records and got 42% of an engineer’s time spent writing code; a survey of 100 engineers recruited through Prolific put it at 30%.[4] The rest goes to review, meetings and planning. Doubling the speed of a third of the work does not double the work.
Four measures moved in stage three.[5]
- Time from opening a pull request to merging it rose from 7.03 days to 10.5 days, an increase of 3.45 days or 49%.
- The share of pull requests that got at least one formal request for changes went from 13% to 25%, close to double.
- Review comments per pull request went from 1.66 to 2.24, up 35%.
- The share of workers doing review rose from 29% to 33%, a 14% increase. The share writing code (43%) was unchanged.
None of these moved significantly for assistants. The pile-up shows up only with agents.
Maybe the chunks being submitted simply got bigger? They did not. Lines of code added per pull request averaged 1,168 and showed no significant change.[6] The same amount of code was coming back with more things to fix and more back-and-forth about them.
A junior engineer quoted in the paper describes how that feels from inside: “People could make a huge number of commits quickly, but code review was still the bottleneck. On one project, only one senior engineer was allowed to approve changes because he was the expert on the codebase. He was so bandwidth constrained that he could only review my code once a week. After some outages that were caused by AI-generated commits, there were also new rules requiring senior engineer approval for AI-generated code, which created even more review bottlenecks.”[5]
AI review tools wrote a quarter of the comments
AI code review tools exist and work: they read a pull request, flag bugs and security problems, and write comments. CodeRabbit, Greptile and GitHub Copilot Reviewer are examples. As of March 2026, nearly 80% of the firms in the sample had used one.[7]
Of all review comments actually left, 23.3% came from AI, and only 10.8% of pull requests received even one AI-generated comment. The tools are installed; humans still do the bulk of the reviewing. A senior engineer in the paper explains why: “Even with AI tools, you absolutely still need humans involved in the review process. I don’t see a time where you will ever not need human oversight, even as tools get better. The AI tools lack the comprehension of the overview of the entire feature, and what it is supposed to do.”[7]
Adoption numbers are worth holding onto. The share of firms using any AI agent went from near zero in October 2024 to above 95% by January 2026. Inside those firms, agent use among engineers reached a median of about 20% twelve months after adoption.[8] The top quintile of firms got to roughly 60%, the bottom quintile to near zero. These results describe organizations where one engineer in five has started using agents, not ones that have switched over.
A second dataset, the same shape
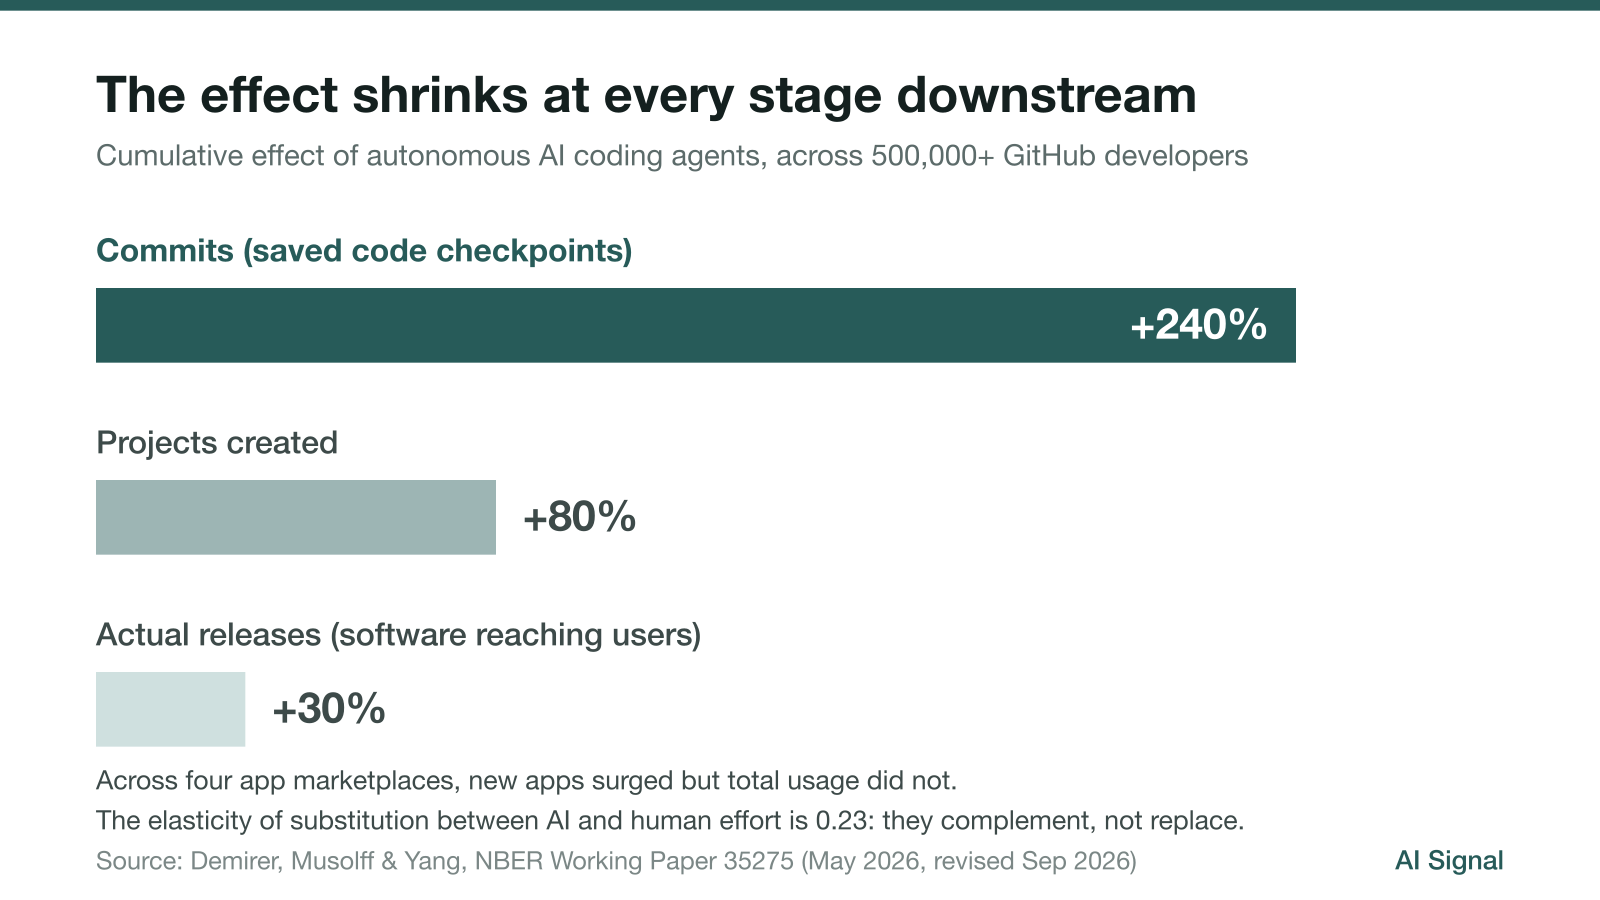
GitHub data shows a similar attenuation. Mert Demirer of MIT, Leon Musolff of Wharton and Liyuan Yang of MIT matched activity data for more than 500,000 GitHub developers with their AI usage telemetry to measure effects across tool generations, in an NBER working paper revised in September.[9]
Cumulative effects on commits: 30% for autocomplete, 180% for interactive agents, 240% for autonomous agents. That 240% falls to 80% for the number of projects created, and to 30% for actual releases, meaning software that reached users. The authors call this the weak-link hypothesis: speed up one stage and the human-held stages set the pace for everything. They estimate an elasticity of substitution of 0.23 between AI and human effort. A value well below 1 means the two complement each other rather than trade off.
The same paper checked four software marketplaces. New apps surged; total usage did not rise. More gets built, the same amount gets used.
Google’s DORA research reached a similar conclusion in its 2025 report: “AI’s primary role is as an amplifier, magnifying an organization’s existing strengths and weaknesses,” with the returns coming from the system around the tools rather than the tools.[10]
What these numbers cannot tell you
The Harvard paper is an unreviewed working paper and Chen’s job market paper. The authors note that Jellyfish read the manuscript only to confirm no proprietary information was disclosed, and that “it was not reviewed for its scientific content.”[1] The sample covers only clients who opted into research use, which carries selection bias.
The data stop in March 2026. The authors say agentic coding is young, that tools have changed considerably since, and that the balance between writing time and reviewing time could shift as teams gain experience. Treatment is defined at the firm level rather than the individual level, so every estimate averages users and non-users together.
Your own sense of the trade-off is not a reliable substitute either. In 2025, METR randomized 246 real issues from the repositories of 16 experienced open-source developers into AI-allowed and AI-forbidden conditions. The AI condition took 19% longer. Developers had forecast a 24% speedup beforehand and, after living through the slowdown, still believed AI had sped them up by 20%.[11] METR notes those results reflect early-2025 tools and have been superseded by a February 2026 update, so they are not a current measurement. The gap between felt and measured is the part that carries over.
Reading the employment result as “AI does not affect jobs” overreaches as well. What the data show is that software firms did not respond to adoption with layoffs within a year or two. Narrowing at the entry level shows up separately in posting data, and competing explanations such as interest rates and the unwinding of pandemic-era overhiring make it impossible to pin the cause on AI.
What to do with this
The authors’ first recommendation to managers is to stop measuring AI by draft volume. Intermediate metrics like lines of code or commits fail to capture what AI actually delivered. Count what made it out instead: deployed, closed, in front of a customer.
The same structure shows up outside code. Wherever drafting and approving are separate jobs, the same thing happens. If an analyst gets ten times faster with AI but one manager signs off on everything, the number of reports going out is set by the manager, and speeding up the first stage only presses harder on that seat. Finding who holds that seat in your own work is the shortest thing to do with this paper.
AI review tools did not clear that seat either. With tools installed at 80% of firms, AI still wrote only a quarter of review comments. Final sign-off remains human, which means a human’s hours still set total throughput.
The mix of work changed more than the amount. The share of people writing code held steady while the share doing review rose 14%. Weight shifted from producing to verifying, which makes reading someone else’s output and catching what is wrong with it a more valuable skill than it was.
One more thought
Airbnb’s disclosure that AI writes 60% of its code came out last week. That figure can be true while the number of finished features is nowhere near 60% higher. The gap between those two statements is what these two papers measure.
The change-request rate going from 13% to 25% deserves its own note. Same size chunks of code, twice as likely to be sent back. Drafts arrived faster and less correct, and the cost of that moved from the person writing to the person reading. Any productivity claim that does not say where the cost went is telling half the story.
—
Sources
- Fiona Chen & James Stratton, “Artificial Intelligence in the Firm: Bottlenecks in Software Production” (August 4, 2026 version)
- Mert Demirer, Leon Musolff & Liyuan Yang, “Writing Code vs. Shipping Code”, NBER Working Paper 35275 (May 2026, revised September 2026)
- METR, Measuring the Impact of Early-2025 AI on Experienced Open-Source Developer Productivity (July 10, 2025)
- DORA, 2025 State of AI-assisted Software Development
Notes
- First version January 7, 2026; current version August 4, 2026. Harvard University; Chen’s job market paper. Jellyfish analytics data, January 2021 to March 2026: 718 firms, 725,938 workers, roughly 300 million work events (200,945,700 commits; 49,050,030 pull requests; 68,281,845 Jira issues; 21,270,247 calendar events). Author note: “The manuscript was reviewed by the data partner solely to verify that it does not disclose proprietary information… it was not reviewed for its scientific content.” Chen & Stratton (2026) ↩
- Assistants: lines of code +12%, commits +9%, pull requests +5%, with only commits significant. Agents: +30%, +20%, +23%, all significant. Chen & Stratton (2026) ↩
- Resolved Jira issues and epics: small positive, statistically insignificant; for agents the estimates rule out an increase larger than 12% of the baseline mean. Employment: rules out declines greater than 2.9% (overall, via LinkedIn) and 13.8% (engineering, via Jellyfish). Chen & Stratton (2026) ↩
- 42% from imputed time allocation; 30% from a survey of 100 Prolific engineers. Chen & Stratton (2026) ↩
- Review length +3.45 days (s.e. 1.60) on a baseline of 7.03 days, a 49% increase. Share with changes requested +0.12 (s.e. 0.01) on a baseline of 0.13. Comments per pull request +0.58 (s.e. 0.11) on a baseline of 1.66, a 35% increase. Share of workers reviewing +0.04 on a baseline of 0.29, a 14% increase. None significant for assistants (review length baseline 9.34 days). Chen & Stratton (2026) ↩
- Lines of code added per pull request: -67.99 (s.e. 126.91) on a baseline of 1,167.97. Chen & Stratton (2026) ↩
- As of March 2026, nearly 80% of firms had used AI code review tools; 23.3% of all review comments were AI-generated; 10.8% of pull requests received at least one AI comment. Chen & Stratton (2026) ↩
- Firm-level agent adoption rose from near zero in October 2024 to over 95% by January 2026. Twelve months after adoption, engineer-level adoption was roughly 20% at the median firm, about 60% in the top quintile and near zero in the bottom quintile. Chen & Stratton (2026) ↩
- More than 500,000 GitHub developers matched with AI usage telemetry, matched event study design. Cumulative commit effects of 30% (autocomplete), 180% (interactive agents) and 240% (autonomous agents); 80% for projects and 30% for releases; elasticity of substitution 0.23; four marketplaces show a sharp rise in new apps but no rise in total usage. NBER Working Paper 35275 ↩
- “AI’s primary role is as an amplifier, magnifying an organization’s existing strengths and weaknesses.” DORA 2025 report overview ↩
- 16 experienced open-source developers, 246 real issues randomized. “We find that when developers use AI tools, they take 19% longer than without.” Forecast 24% speedup; post-hoc belief 20% speedup. METR notes the results reflect early-2025 tooling and were superseded by a February 2026 update. METR (July 10, 2025) ↩
Source: https://fion.ac/jellyfish.pdf